By Jared Dineen Shanstrom, REALTOR, The Dineen Shanstrom Group at Equity Union · September 8, 2026The short versionThe 30-year fixed mortgage sits around 6.74 percent as of

Dated: August 14 2026
Views: 229
Coachella Valley Housing Market Data, Updated August 2026
By Jared Dineen Shanstrom, REALTOR® · The Dineen Shanstrom Group · Equity Union
The Coachella Valley real estate market is splitting in two. One side is working. One side is not. And the gap between them is getting wider.
In July, 495 homes sold across the greater Palm Springs market. The median price rose to $635,000, up 2.8% year-over-year. The list-price-to-sale-price ratio improved to 97.4%. By those measures, the market looks healthier than it has in months.
At the same time, 629 listings expired, cancelled, or withdrew. That is more than the number of homes that actually closed. For the second straight month, more listings failed than succeeded.
Both of those things are true. And that is the story.
The homes that are priced correctly are selling faster and closer to asking than they were 60 days ago. The homes that are not priced correctly are failing at a historic rate. The market is not slow. It is selective. And with inventory now at its lowest level since 2022, that selectivity is about to have real consequences heading into fall.
In This Report
July 2026 Market Summary The Inventory Story: Down 30% in Five Months The Two-Market Problem: Sold vs Failed Is the Median Price Increase Real? What This Means for Buyers and Sellers July 2026 Data by City and Property Type What to Watch Heading Into Fall Frequently Asked QuestionsThe Coachella Valley recorded 495 closed residential sales in July 2026, down 9.0% from July 2025 (544 sales). That decline is consistent with the seasonal pattern. July is always one of the slowest months in the desert.
The valley-wide median sold price was $635,000, up 2.8% from $618,000 last July. That is the first year-over-year price increase since early spring.
Average days on market came in at 72.2, basically flat from last year (71.2). The median list-price-to-sale-price ratio improved to 97.4%, up from 96.5% in June and 97.3% a year ago. Sellers who priced correctly gave back less than they have in months.
Total closed volume was $450 million. The high sale was $17.5 million.
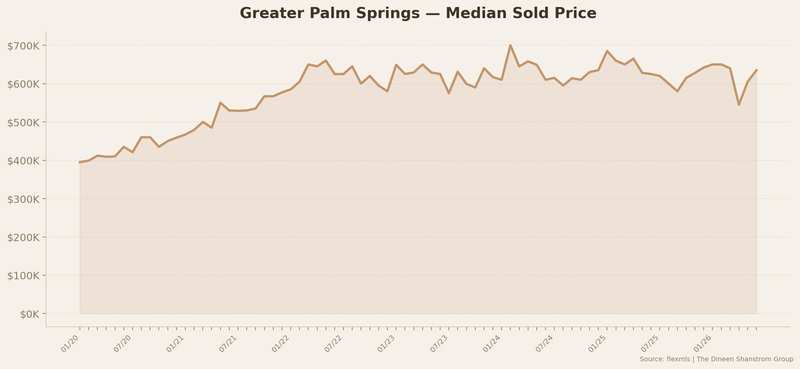
Greater Palm Springs median sold price, Jan 2020 through Jul 2026. Source: flexmls (CRMLS).
This is the biggest story in the market right now, and it has been building since spring.
Active listings across the valley dropped to 2,641. In March, there were 3,793. That is a decline of 1,152 listings. 30% of the available inventory has disappeared in five months.
Valley-wide months of supply now sits at approximately 4.7. In March it was 6.0. In January it was above 7 in several cities. The direction has been consistent and accelerating.
| Month | Active Listings | Change |
|---|---|---|
| March 2026 | 3,793 | Starting point |
| May 2026 | 3,203 | -590 (-15.6%) |
| June 2026 | 3,071 | -132 (-4.1%) |
| July 2026 | 2,641 | -430 (-14.0%) |
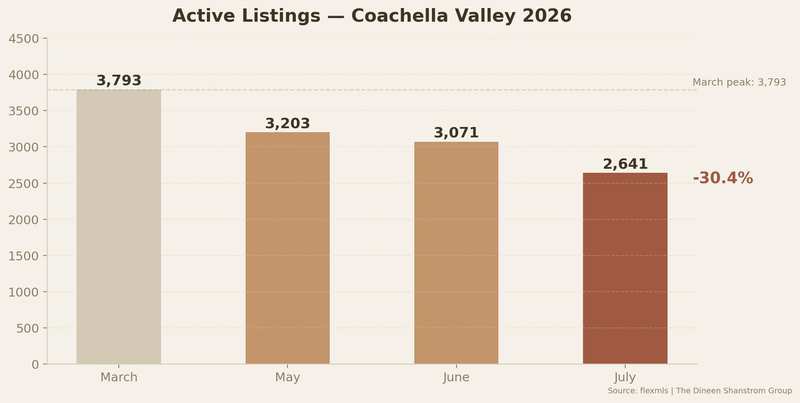
Active residential listings, Coachella Valley, 2026. A 30% decline in five months.
This matters because inventory is a leading indicator. Prices follow supply. When there are fewer homes to choose from, competition increases, negotiating leverage shifts, and prices eventually respond.
That response has not fully materialized yet. But the conditions are building. And with seasonal buyer demand returning in October, the math is moving in one direction.
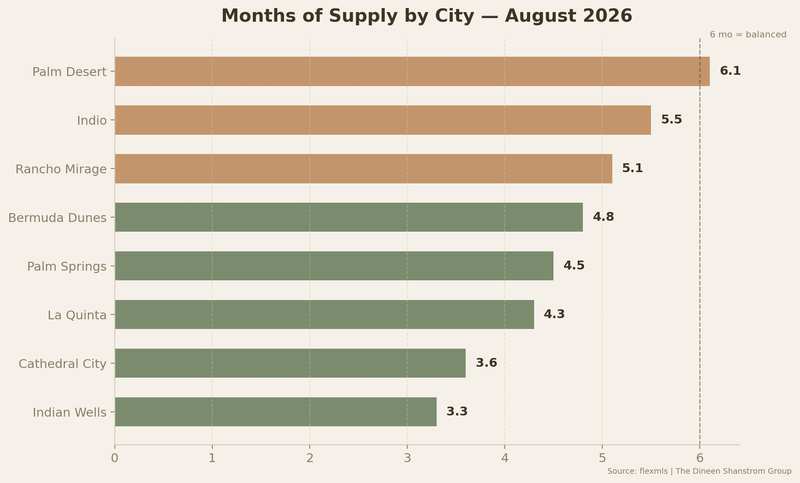
Months of supply by city. Six months is considered balanced. Most cities are now well below that line.
For the second consecutive month, more listings expired, cancelled, or withdrew than actually closed. In July: 629 failures vs 495 closings. That is 127 failed listings for every 100 successful sales.
Here is what makes this paradox interesting. The homes that did sell performed better than they have in months. LP/SP improved from 96.5% in June to 97.4% in July. DOM held steady. The median price ticked up year-over-year for the first time in a while.
So the successful sales are getting stronger while the failure rate gets worse. How?
Because the market is polarizing. Correctly priced homes in desirable locations are attracting buyers quickly and closing near asking. Overpriced listings are sitting, languishing, and eventually expiring. There is less and less middle ground.
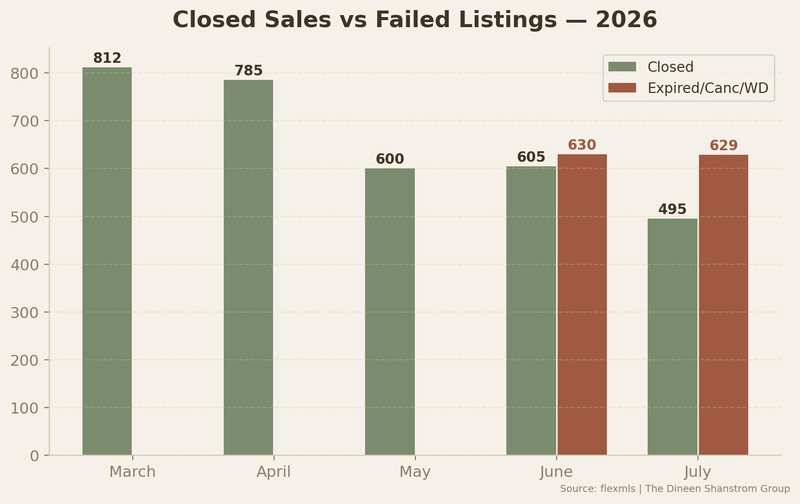
Closed sales vs failed listings, 2026. In June and July, more listings failed than succeeded.
The market is not punishing sellers. It is punishing bad pricing. That is an important distinction. If you price at market, you will sell. The data is clear on that. But the margin for error has gotten razor thin.
The valley-wide median rose from $618K (July 2025) to $635K (July 2026). That is a 2.8% increase. But as we have covered in prior months, the combined median can be misleading.
Condo share in July dropped to 32.5%, down from about 40% earlier in the year. When fewer condos trade as a share of total sales, the combined median rises even if individual property values have not changed.
That said, some of the price strength is real. Palm Desert's median jumped 14.7% year-over-year even with a higher condo share (45% vs 36%). Cathedral City SFR is closing at 99.5% of asking. Indian Wells hit $2.5M. These are not just mix effects.
The honest read: prices are stable to slightly up across most product types. The 2.8% headline number overstates it slightly due to mix shift, but the direction is no longer flat. It is tilting positive, which is consistent with what the inventory data would predict.
The math is straightforward and it is not moving in your favor. There are 1,152 fewer homes on the market than five months ago. When seasonal buyers return in October, they will be competing for a smaller pool of listings.
Right now, you still have negotiating room. LP/SP at 97.4% means sellers are giving back 2.6% on average. DOM at 72 days means you have time to evaluate. Those conditions are unlikely to hold if inventory keeps tightening.
The 629 expired listings are worth watching. Many of those will relist at reduced prices in August and September. That could create short-term buying opportunities before season picks up.
The market is doing what you need it to do. Inventory is dropping, competition is thinning, and the homes that are priced correctly are closing stronger than they have all year.
But 629 listings also failed this month. Nearly all of them were overpriced. The market has no patience for aspirational pricing right now. Price it right and you will sell in a reasonable timeframe. Miss by 5-10% and you are likely to sit through the summer and into fall without a contract.
If you are planning to list in fall, the setup is strong. Less competition from other sellers, returning seasonal demand, and tightening supply.
Ordered west to east. SFR first, then Condo/TH for each city.
| Market | Sales | Median Price | Med DOM | Med LP/SP | Market Condition |
|---|---|---|---|---|---|
| Palm Springs SFR | 68 | $999,500 | 47 | 97.0% | Seller Leaning |
| Palm Springs Condo/TH | 63 | $410,000 | 63 | 97.4% | Seller Leaning |
| Cathedral City SFR | 39 | $525,000 | 39 | 99.5% | Seller's Market |
| Cathedral City Condo/TH | 10 | $267,500 | 64 | 95.0% | Buyer Leaning |
| Rancho Mirage SFR | 38 | $1,087,500 | 47 | 96.6% | Seller Leaning |
| Rancho Mirage Condo/TH | 14 | $605,000 | 49 | 97.5% | Balanced |
| Palm Desert SFR | 53 | $765,000 | 66 | 97.5% | Balanced |
| Palm Desert Condo/TH | 43 | $445,000 | 60 | 96.6% | Balanced |
| Indian Wells SFR | 15 | $2,500,000 | 91 | 95.1% | Seller Leaning |
| Indian Wells Condo/TH | 4 | $2,425,000 | 136 | 95.3% | Balanced |
| La Quinta SFR | 53 | $644,000 | 54 | 97.8% | Seller Leaning |
| La Quinta Condo/TH | 21 | $730,000 | 60 | 97.0% | Balanced |
| Indio SFR | 62 | $549,984 | 57 | 98.3% | Seller Leaning |
| Indio Condo/TH | 4 | $374,500 | 34 | 100.0% | Seller Leaning |
| Bermuda Dunes SFR | 6 | $752,000 | 98 | 97.5% | Balanced |
| Bermuda Dunes Condo/TH | 2 | $420,000 | 88 | 98.3% | Seller Leaning |
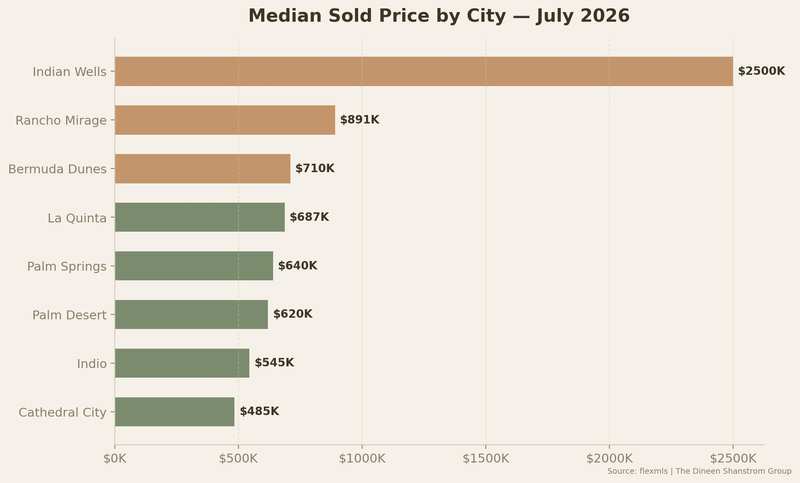
131 sales, $640K combined median. SFR median just under $1M with a median DOM of 47 days and 97.0% LP/SP. Condos at $410K, 63 days DOM. Palm Springs continues to be the deepest, most liquid market in the valley with a near-even SFR/condo split (52/48). 4.5 months supply. Seller leaning across both property types.
49 sales, up 29% year-over-year. The standout this month. SFR median $525K with 39 days DOM and a 99.5% LP/SP ratio. That is effectively a competitive market where sellers are getting full asking price. Condos are softer at $267K with 95.0% LP/SP. At 3.6 months supply, Cathedral City is the tightest market in the valley and continues to outperform as the most affordable entry point.
52 sales, $891K combined median. SFR at $1,087,500 with 47 days DOM. The single-family median has held between $975K and $1.4M for 18 straight months. Condos at $605K with a strong 97.5% LP/SP. 5.1 months supply. Balanced to seller leaning.
96 sales, $619K median. Volume is down 21% YoY but the median jumped 14.7%. Condo share rose to 45% from 36%, which would normally pull the median down, meaning the underlying price strength is real. SFR at $765K, condos at $445K. 6.1 months supply. The closest to balanced of any major market in the valley.
19 sales, $2.5M median, up 47.9% YoY. The luxury end is firing. SFR at $2.5M with 91 days DOM. Only 69 active listings and 3.3 months supply makes this the tightest inventory in the valley. LP/SP at 95.1% tells you there is still negotiating room on luxury, but the leverage is shifting.
74 sales, $687K combined median. SFR at $644K with 54 days DOM and 97.8% LP/SP. Condos at $730K, which reflects the country club product in PGA West and club communities. Volume down 19% YoY. Condo share tripled from 10% to 28%, which is driving the median movement. 4.3 months supply. Seller leaning.
66 sales, $545K median. SFR at $550K with 57 days DOM and 98.3% LP/SP. Indio has improved significantly from the 90+ day DOM it posted in April and May. Sellers are adjusting pricing expectations and the market is responding. 5.5 months supply. A small condo market (only 4 sales) but they closed at 100% of asking.
8 sales. Small sample, unreliable median. SFR at $752K with a high DOM of 98 days. 4.8 months supply. Functional micro-market but not one to draw broad conclusions from monthly.
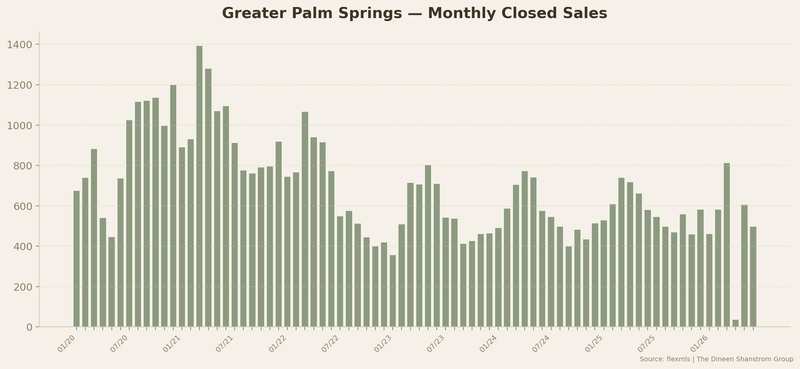
Monthly closed sales volume, greater Palm Springs, Jan 2020 through Jul 2026.
August will be the quietest month of the year. It always is. Fewer showings, fewer offers, fewer closings. That is the desert in summer.
But what happens in September and October depends on where these three numbers land:
1. Active inventory in September. If it stays below 2,800, fall will be competitive. Seasonal buyers returning to fewer than 2,700 listings would be the tightest supply since early 2022. If it rebounds above 3,200 with a wave of new fall listings, the market rebalances and buyers get more options.
2. The expired listing pipeline. 629 listings failed in July alone. Some will relist at lower prices in August and September. That wave of price-reduced inventory could create a short window of opportunity for buyers before season demand picks up.
3. Single-family vs condo medians. The combined median is up 2.8% YoY, but condo share dropped. Watch the SFR median independently. If it breaks above $650K valley-wide for two consecutive months, prices are genuinely moving up, not just mixing up.
The market is not slow. It is sorting. The correctly priced homes are selling better than they have all year. The overpriced homes are failing at record rates. With 30% less inventory than five months ago, the homes that are positioned right heading into fall season are going to do very well.
The median sold price in July 2026 was $635,000, up 2.8% year-over-year. This is the first YoY increase in several months. Active inventory has dropped 30% since March. When comparing single-family to single-family, prices are stable to slightly up across most cities. The combined median can be misleading due to shifts in the ratio of condo vs single-family sales each month.
As of August 2026, there are 2,641 active residential listings across the greater Palm Springs market. That is down 30% from 3,793 in March 2026. Palm Springs and Palm Desert have the most inventory (643 and 642 respectively). Indian Wells has the least at 69 active listings.
Conditions in summer 2026 still offer buyers some advantages: 72 days on market gives time to evaluate, and sellers are accepting about 97.4% of asking. But inventory has been declining for five straight months and is at its lowest since 2022. Buyers who act before fall season returns will have more choices and less competition than those who wait until October and November.
Indian Wells has the highest median home price at $2,500,000 (July 2026), up 47.9% year-over-year. It is a small-volume luxury market with only 19 sales in July. La Quinta ($687K) and Rancho Mirage ($891K) are the next highest-priced major markets.
Cathedral City has the lowest median at $485,000 with the fastest DOM (66.9 days) and tightest supply (3.6 months). It is also the only market where SFR is closing at 99.5% of asking. Indio ($545K) and Palm Desert ($619K) are the next most affordable options.
In July 2026, 629 listings expired, cancelled, or withdrew while only 495 sold. This is almost entirely a pricing issue. Buyers are active but selective. Homes priced at market are selling. Homes priced 5-10% above market are sitting and eventually failing. The list-price-to-sale-price ratio of 97.4% confirms buyers will negotiate but will close when the price is reasonable.
This analysis covers the eight cities of the greater Palm Springs / Coachella Valley market: Palm Springs, Cathedral City, Rancho Mirage, Palm Desert, Indian Wells, La Quinta, Indio, and Bermuda Dunes. Data is sourced from flexmls (CRMLS). Only single-family homes and condos/townhomes are included. Listings where the sale price deviated more than 50% from list price are excluded. Months of supply is calculated using a trailing three-month average sales pace against current active inventory.
I publish this report monthly. If you want analysis specific to your neighborhood, subdivision, or price range, reach out. I run these numbers daily.
Want the numbers for your neighborhood?
Jared Dineen Shanstrom, REALTOR® | The Dineen Shanstrom Group
(760) 234-2774 | jared@dsgrealtors.com
Data: flexmls (CRMLS) · 82,000+ closed sales analyzed · Jan 2017 – Jul 2026
The Dineen Shanstrom Group · Equity Union · DRE# 02130665
Greater Palm Springs Real Estate · Palm Springs Homes for Sale · Palm Desert Real Estate · Rancho Mirage Homes · La Quinta Real Estate · Indian Wells Luxury Homes · Cathedral City Homes · Indio Real Estate · Bermuda Dunes · Coachella Valley Housing Market · Desert Real Estate Market Report

Jared Dineen Shanstrom is a trusted real estate professional known for his calm, client-focused approach and deep knowledge of the Greater Palm Springs market. As the founder of The Dineen Shanstrom G....
By Jared Dineen Shanstrom, REALTOR, The Dineen Shanstrom Group at Equity Union · September 8, 2026The short versionThe 30-year fixed mortgage sits around 6.74 percent as of
Coachella Valley Housing Market Update: August 2026 (And Why the Median Is Misleading)By Jared Dineen Shanstrom, REALTOR, The Dineen Shanstrom Group at Equity UnionSeptember 4, 2026 |
Mortgage Rates Near a One-Year High: What It Means for Coachella Valley Buyers and SellersBy Jared Dineen Shanstrom, REALTOR, The Dineen Shanstrom Group at Equity Union · August,
Buyer's GuideBuying a Mid-Century Modern Home in Palm SpringsThe architects, the neighborhoods, and what to actually check before you buy an Alexander.Published August 2026 · By Jared Dineen
 Based on information from California Desert Association of Realtors as of September 20, 2026 3:47 AM UTC The information being provided by California Desert Association of Realtors, SoCalMLS, CRISNet MLS, and CARETS is for the consumer's personal, non-commercial use and may not be used for any purpose other than to identify prospective properties consumer may be interested in purchasing. Any information relating to real estate for sale referenced on this web site comes from the Internet Data Exchange
(IDX) program of the SCalifornia Desert Association of Realtors, SoCalMLS, CRISNet MLS, and CARETS. ZipRealty, Inc. is not a Multiple Listing Service (MLS), nor does it offer MLS access. This website is a service of ZipRealty, Inc., a broker participant of California Desert Association of Realtors, SoCalMLS, CRISNet MLS, or CARETS. This web site may reference real estate listing(s) held by a brokerage firm other than the broker and/or agent who owns this web site.
The accuracy of all information, regardless of source, including but not limited to open house information, square footages and lot sizes, is deemed reliable but not guaranteed and should be personally verified through personal inspection by and/or with the appropriate professionals. The data contained herein is copyrighted by California Desert Association of Realtors, SoCalMLS, CRISNet MLS, and CARETS and is protected by all applicable copyright laws. Any unauthorized dissemination of this information is in violation of copyright laws and is strictly prohibited.
Copyright 2026 California Desert Association of Realtors, SoCalMLS, CRISNet MLS, and CARETS. All rights reserved. Certain information contained herein is derived from information which is the licensed property of, and copyrighted by, SoCalMLS Inc
Data last updated: September 20, 2026 3:47 AM UTC
If a listing displays "Short Sale/Subject to Lender Approval" then that listing has been identified by the seller and the listing broker as a "Short sale." This means that, at the listed price, the proceeds from the sale may not be adequate to pay all liens and costs of sale. Any offer made that does not fully cover the existing amount(s) owed to the lienholder(s) plus the costs of sale could be subject to lienholder approval, which approval may be exercised at the sole and exclusive discretion of the lienholder(s).
Show More...
Based on information from California Desert Association of Realtors as of September 20, 2026 3:47 AM UTC The information being provided by California Desert Association of Realtors, SoCalMLS, CRISNet MLS, and CARETS is for the consumer's personal, non-commercial use and may not be used for any purpose other than to identify prospective properties consumer may be interested in purchasing. Any information relating to real estate for sale referenced on this web site comes from the Internet Data Exchange
(IDX) program of the SCalifornia Desert Association of Realtors, SoCalMLS, CRISNet MLS, and CARETS. ZipRealty, Inc. is not a Multiple Listing Service (MLS), nor does it offer MLS access. This website is a service of ZipRealty, Inc., a broker participant of California Desert Association of Realtors, SoCalMLS, CRISNet MLS, or CARETS. This web site may reference real estate listing(s) held by a brokerage firm other than the broker and/or agent who owns this web site.
The accuracy of all information, regardless of source, including but not limited to open house information, square footages and lot sizes, is deemed reliable but not guaranteed and should be personally verified through personal inspection by and/or with the appropriate professionals. The data contained herein is copyrighted by California Desert Association of Realtors, SoCalMLS, CRISNet MLS, and CARETS and is protected by all applicable copyright laws. Any unauthorized dissemination of this information is in violation of copyright laws and is strictly prohibited.
Copyright 2026 California Desert Association of Realtors, SoCalMLS, CRISNet MLS, and CARETS. All rights reserved. Certain information contained herein is derived from information which is the licensed property of, and copyrighted by, SoCalMLS Inc
Data last updated: September 20, 2026 3:47 AM UTC
If a listing displays "Short Sale/Subject to Lender Approval" then that listing has been identified by the seller and the listing broker as a "Short sale." This means that, at the listed price, the proceeds from the sale may not be adequate to pay all liens and costs of sale. Any offer made that does not fully cover the existing amount(s) owed to the lienholder(s) plus the costs of sale could be subject to lienholder approval, which approval may be exercised at the sole and exclusive discretion of the lienholder(s).
Show More...
