By Jared Dineen Shanstrom, REALTOR, The Dineen Shanstrom Group at Equity Union · September 8, 2026The short versionThe 30-year fixed mortgage sits around 6.74 percent as of

Dated: July 1 2026
Views: 225
Coachella Valley Housing Market Data, Updated July 2026
By Jared Dineen Shanstrom, REALTOR® · The Dineen Shanstrom Group · Equity Union
The Greater Palm Springs real estate market closed 605 sales in June 2026 with a median price of $605,000.
At first glance, that looks like a pretty straightforward market update. Sales are up slightly from last year, the median price is down slightly, and homes are taking about 73 days to sell.
But the real story is underneath the headline.
Inventory has now dropped for four straight months. More listings expired, cancelled, or withdrew than actually sold. And the median price decline is not as simple as it looks.
In other words, the market is not falling apart. Buyers are still buying. Sellers are still selling. But the market is being much less forgiving when a home is overpriced.
Here's what actually happened across the Coachella Valley in June.
In This Report
June 2026 Market Summary Why More Listings Failed Than Sold Why the Median Price Decline Is Misleading Inventory by City: What's Tightening, What's Not What This Means for Buyers and Sellers City-by-City Data: Palm Springs, Palm Desert, La Quinta & More Where Buyers Are Buying: Price Bracket Breakdown Summer Outlook: Three Numbers to Watch Frequently Asked QuestionsAcross the Coachella Valley, there were 605 residential sales in June 2026. That is up 4.3% from June 2025, when 580 homes sold.
The valley-wide median sold price was $605,000, down from $625,000 last June. That is a 3.2% year-over-year decline on paper.
Average days on market came in at 72.8 days, which is basically flat from last year. The average list-price-to-sale-price ratio dropped to 96.5%, compared to 97.1% one year ago.
Active inventory finished June at 3,071 listings. That is down from 3,793 in March and 3,203 in May. Put another way, inventory has dropped 19% in four months.
The biggest number in this report may not be sales or prices. It is the 630 listings that expired, cancelled, or withdrew in June. That is more than the 605 homes that closed.
That tells us a lot about where the market is.
Buyers are not gone. They are just not chasing overpriced listings.
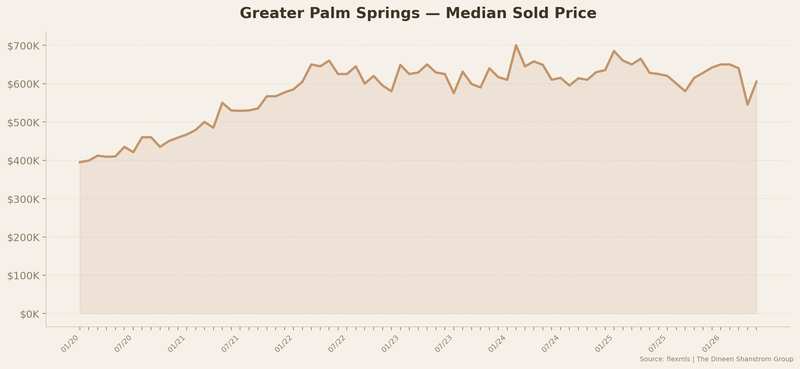
Greater Palm Springs median sold price, Jan 2020 through Jun 2026. Source: flexmls (CRMLS).
In June, 630 listings across the Coachella Valley expired, cancelled, or withdrew. Only 605 closed.
That is the most important data point in the entire report.
This is not a dead market. Sales volume is actually up from last year. But buyers are buying at the prices they are willing to pay, not the prices sellers hoped they could get.
The list-price-to-sale-price ratio of 96.5% confirms that gap. On a $600,000 home, that means sellers are giving back about $21,000 from the asking price on average. Last year, that number was closer to $17,400.
That may not sound like a major shift, but it matters.
The homes that are priced correctly are still selling. The homes that are 5% to 10% too high are sitting, reducing, and in many cases not selling at all.
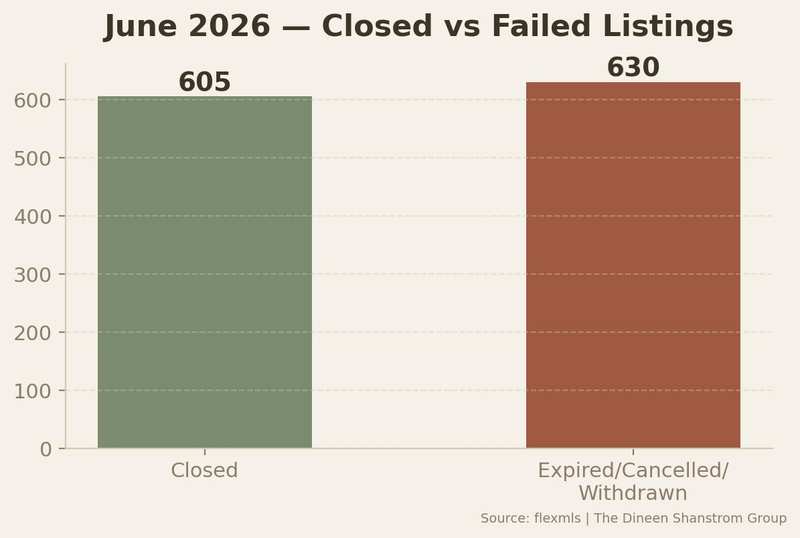
June 2026: 605 homes sold, 630 listings expired or were cancelled. The market is functional but punishing overpricing.
If you are thinking about selling in the Coachella Valley right now, your pricing strategy is the biggest decision you will make. Marketing matters. Presentation matters. Exposure matters. But none of it fixes a price that is disconnected from the market.
Not really.
This is where a lot of market summaries miss the point.
The valley-wide median price is down 3.2% year-over-year. If you only look at that one number, it looks like prices are falling.
But when you separate single-family homes from condos and townhomes, the picture changes.
What is moving the median is often the mix of what sold, not a major change in actual property values.
Rancho Mirage is a good example. Over the last 18 months, the combined median price has bounced between $749,000 and $1,050,000. That looks volatile. But when you separate single-family homes from condos, the market is much more stable.
The single-family median in Rancho Mirage has generally stayed between $975,000 and $1.4 million. The condo median has generally stayed between about $490,000 and $690,000.
So when more condos sell in a given month, the combined median drops. When fewer condos sell, the combined median rises.
That does not necessarily mean home values are moving that dramatically.
| Month | SF Median | Condo Share | Combined Median | What's Driving It |
|---|---|---|---|---|
| Apr 2025 | $1,355K | 32% | $1,050K | Fewer condos sold, median reads high |
| Jun 2025 | $1,200K | 38% | $749K | More condos sold, median drops $300K |
| Jan 2026 | $1,065K | 40% | $827K | Highest condo share of the year |
| Jun 2026 | $1,130K | 26% | $900K | Fewer condos, median "recovers" |
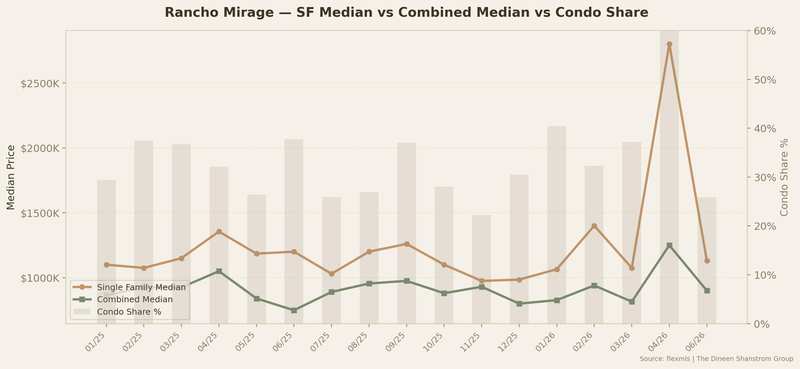
Rancho Mirage: the single-family median (orange) is stable. The combined median (green) swings based on condo share (gray bars).
Palm Springs has a large condo market, so its median can swing depending on the single-family to condo mix. Indian Wells can look especially volatile because there are so few sales each month and a small number of condo or luxury sales can move the median dramatically.
Cathedral City showed the reverse pattern. May 2025 had 43% condo share and a $429K median. June 2026 at just 15% condo share posted a $535K median. The single-family median? $530K to $615K with no real movement either way.
The takeaway is simple: do not compare the overall median without looking at what actually sold.
If you own a single-family home, compare it to single-family homes. If you own a condo, compare it to condos. That is where the real value picture is.
When you compare like to like, prices across most of the Coachella Valley have been relatively flat to slightly up over the last year. The market is not surging, but it is also not seeing the broad price decline that the headline median may suggest.
Active listings across the greater Palm Springs area fell to 3,071 in June 2026, down from 3,793 in March. That's a 19% drop in four months. Months of supply varies significantly by city:
| City | Active Listings | Months of Supply | March Level | Market Condition |
|---|---|---|---|---|
| Cathedral City | 229 | 4.2 | 6.0 | Seller advantage |
| Palm Desert | 722 | 4.8 | 6.0 | Seller advantage |
| Palm Springs | 727 | 4.9 | 6.3 | Slight seller advantage |
| Indio | 428 | 5.1 | 6.0 | Balanced-tight |
| La Quinta | 441 | 5.2 | 5.2 | Balanced-tight |
| Bermuda Dunes | 49 | 6.1 | 8.6 | Balanced |
| Rancho Mirage | 361 | 6.2 | 7.2 | Balanced |
| Indian Wells | 114 | 7.6 | 7.2 | Buyer leverage (seasonal) |
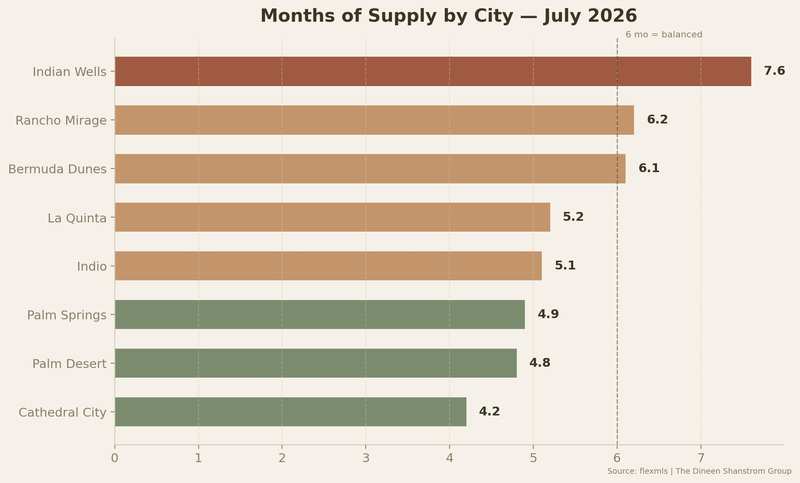
Months of supply by city, July 2026. Six months is considered balanced. Below that favors sellers, above favors buyers.
Cathedral City (4.2 months), Palm Desert (4.8), and Palm Springs (4.9) are the tightest markets in the valley. Indian Wells moved above 6 months as luxury sales thin out for summer — that's seasonal, not structural, and will likely reverse when snowbird buyers return in October.
Conditions are actually favorable right now, but the window may be closing. Inventory has dropped 19% in four months. DOM is still 70+ days, giving you time to evaluate. Sellers are accepting 3.5% below asking on average. Those are buyer-friendly conditions.
But the trend is moving against you. If inventory stays below 3,200 through August, October will bring returning seasonal demand against fewer available homes. Buyers who act in summer have more choices and more negotiating room than those who wait for fall.
The 630 expired listings are also relevant. Some of those will relist at lower prices in fall. Watch for price reductions in August and September as motivated sellers adjust before season.
The supply math is moving in your favor. Fewer competing listings every month. But the expired listing data is a warning: 630 listings failed in June because sellers overpriced them. The market is not forgiving on pricing right now. LP/SP at 96.5% means you need to be within 3-4% of true market value from day one.
If you're thinking about listing in fall, the setup is encouraging. Lower inventory heading into peak season means less competition. But price it based on what the data says, not what you hope your home is worth.
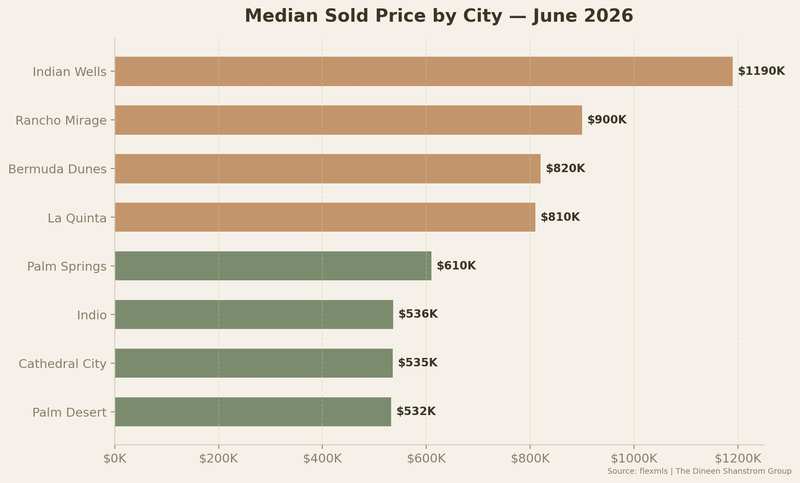
| City | Sales | Median Price | YoY Change | Avg DOM | Med $/SqFt |
|---|---|---|---|---|---|
| Palm Springs | 149 | $610K | -17.6%* | 69.1 | $386 |
| Palm Desert | 151 | $532K | -9.1%* | 72.4 | $317 |
| Rancho Mirage | 58 | $900K | +20.2%* | 67.0 | $386 |
| La Quinta | 85 | $810K | +7.3% | 84.4 | $362 |
| Indian Wells | 15 | $1.19M | -29.6%* | 87.8 | $479 |
| Cathedral City | 55 | $535K | +6.2% | 66.7 | $293 |
| Indio | 84 | $536K | -6.6% | 76.7 | $278 |
| Bermuda Dunes | 8 | $820K | +21.4% | 36.1 | $307 |
*YoY swings marked with an asterisk are primarily driven by shifts in the condo-to-single-family sales ratio, not by actual price changes. See mix shift analysis above.
149 closed sales, up 15.5% year-over-year. The $610K headline median looks soft compared to last June's $740K, but last June had higher single-family concentration (52% vs 47% this month). The single-family median was $1,050K. Condos at $355K. DOM 69 days. 4.9 months supply. Still the deepest, most liquid market in the valley with the highest $/SF outside Indian Wells.
Volume leader with 151 closings, up 26.9% year-over-year. Median at $532K with a 38% condo share (up from 32% last June). Single-family median held at $594K. The $400K to $800K core of this market is the most consistent and liquid in the Coachella Valley. 4.8 months supply. DOM 72 days.
58 sales, up 9.4% year-over-year. The $900K median looks like a big rebound from recent months, but as covered above, it's driven by condo share dropping to 26% from 38% last June. Single-family median at $1,130K, right in line with the 18-month average. DOM improved to 67 days. 6.2 months supply. Conditions are balanced here heading into summer.
85 sales, down 22% in volume but median up 7.3% to $810K. Condo share is naturally low here at 13%, so the median is a more reliable indicator than in condo-heavy cities. DOM at 84.4 days is elevated. 5.2 months supply. Fewer transactions at higher price points. The PGA West and country club communities continue to drive significant month-to-month variation.
Only 15 sales — summer thins this luxury market rapidly. Median at $1.19M with a 40% condo share. Single-family median was $1,575K. DOM at 87.8 days. 7.6 months supply puts this in buyer-leverage territory, but that's seasonal. Indian Wells posted strong numbers in April and May ($1.83M and $1.34M medians) and will likely rebound when seasonal buyers return in Q4.
55 sales, up 17% year-over-year. Median $535K, up 6.2% YoY. Only 15% condo share, so this is a reliable number. Single-family median at $565K. DOM 66.7 days — fastest market in the valley. 4.2 months supply — tightest in the valley. Cathedral City continues to be the most affordable entry point to the greater Palm Springs market and it is consistently outperforming on volume, price appreciation, and time to sell.
84 sales, down 4.5%. Median $536K, down 6.6%. DOM improved to 76.7 days from the 90+ days seen in April and May. 5.1 months supply. Indio's condo share is very small (2-4%), so the median here largely reflects single-family pricing. Prices are softening slightly, and overpriced listings have been sitting longer here than anywhere else in the valley. That said, the DOM improvement from 93 to 77 days suggests sellers are beginning to adjust.
8 sales. With volume this low, monthly data is unreliable. The median swings dramatically based on whether a couple of higher-end sales close. 6.1 months supply with only 49 active listings. A functional micro-market, but not one to draw broad conclusions from on a monthly basis.
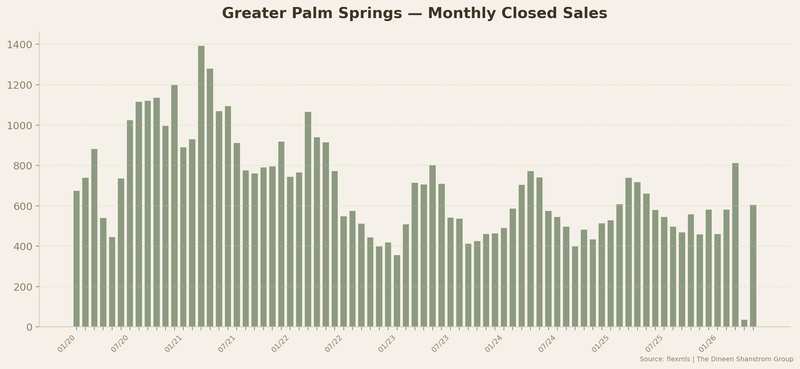
Monthly closed sales volume, greater Palm Springs, Jan 2020 through Jun 2026. Seasonal patterns are consistent year to year.
The distribution of sales by price range shifted notably in June compared to spring. The affordable end of the market gained share, while luxury pulled back:
| Price Range | June Sales | Share | Trend vs Spring |
|---|---|---|---|
| Under $300K | 39 | 6.4% | Growing — affordable demand is strong |
| $300K - $500K | 167 | 27.6% | Up from 22% — summer buyers skew here |
| $500K - $750K | 176 | 29.1% | Down from 35% — still the largest bracket |
| $750K - $1M | 78 | 12.9% | Holding steady |
| $1M - $2M | 107 | 17.7% | Up slightly — luxury holding at lower tier |
| $2M - $5M | 33 | 5.5% | Down from 6.5% — summer pullback |
| $5M+ | 5 | 0.8% | Down from 1.5% — ultra-luxury quiet |
The $300K to $500K bracket grew from 22% to nearly 28% of all sales. This is another reason the combined valley median dropped — more transactions happened at lower price points, not because those homes got cheaper, but because that's where summer buyers are concentrating.
Above $2M, activity thinned out as seasonal luxury buyers stepped away. The $5M+ bracket dropped from 12 sales in spring months to just 5 in June. Expect this to reverse in Q4 when high-net-worth seasonal residents return to the desert.
July and August will be the quietest months of the year. That happens every summer in the desert. Sales will drop, DOM will increase, and the market will feel slower. That's not a sign of trouble — it's a 115-degree reality.
Three numbers are worth tracking heading into fall:
1. Active inventory. It went from 3,793 in March to 3,071 in June. If it holds below 3,200 through August, October and November will bring seasonal buyer demand against a tighter supply. That sets up a competitive fall market with potential upward pressure on prices.
2. The expired listing ratio. June's 630 failures vs 605 closings tells you sellers are still overshooting. If that ratio stays inverted through summer, watch for a wave of price reductions in August and September. Motivated sellers capitulating before season could create buying opportunities.
3. Single-family vs condo medians separately. The combined median is misleading without controlling for product type. If single-family prices start actually declining (not just mix-shifting), that would be a real signal. So far through 18 months of data, they haven't.
The market is functional, demand is real, and prices are stable when you look at like-for-like comparisons. The only thing being punished right now is overpricing. That's a healthy market doing exactly what it should.
Summer 2026 offers buyers more inventory (3,071 active listings), longer negotiating windows (72+ days on market), and sellers accepting 3.5% below asking on average. Inventory has been declining for four months, so the selection available now may be better than what's available when season picks back up in October. Well-priced homes in good locations are still selling. The most leverage exists in Indian Wells (7.6 months supply) and Rancho Mirage (6.2 months).
The combined median is down 3.2% year-over-year. However, this is primarily a mix shift — more condos are selling relative to single-family homes, which pulls the combined number down. When comparing single-family to single-family or condos to condos, prices have been flat to slightly up across most Coachella Valley cities for over 18 months.
Cathedral City has the lowest median home price at $535,000 (June 2026) and is also the fastest-selling market in the valley at 66.7 days on market. Prices are up 6.2% year-over-year. It's followed by Palm Desert ($532K), Indio ($536K), and Palm Springs ($610K). For buyers under $500K, Cathedral City offers the strongest combination of value, appreciation, and sell-through speed.
Indian Wells has the highest median home price at $1.19 million (June 2026). However, Indian Wells is a small-volume market (15 sales in June) and the median fluctuates significantly based on what trades. La Quinta ($810K) and Rancho Mirage ($900K) are the next highest-priced markets with more consistent volume.
Both have advantages. Selling in summer means fewer competing listings (inventory is at a 4-month low). Selling in fall means more active buyers (seasonal residents return in October). The key in either scenario is pricing: in June 2026, more listings expired than sold (630 vs 605), almost entirely due to overpricing. Regardless of when you list, pricing at market value from day one is the most important factor in a successful sale.
Valley-wide average is 72.8 days as of June 2026. The fastest market is Cathedral City at 66.7 days. The slowest is Indian Wells at 87.8 days. For context, the average was about 29 days during the peak frenzy of early 2022 and 63 days in June 2025. Current DOM levels represent a normalized, healthy pace — not a distressed market.
This Greater Palm Springs real estate market report is based on 82,000+ closed residential sales in the Coachella Valley from January 2017 through June 2026, sourced from flexmls (CRMLS). The analysis covers eight cities: Palm Springs, Palm Desert, Rancho Mirage, La Quinta, Indian Wells, Cathedral City, Indio, and Bermuda Dunes.
Only single-family homes and condos/townhomes are included. Manufactured homes, vacant land, and other property types are excluded. Listings where the sale price deviated more than 50% from the list price are excluded as outliers. Months of supply is calculated using the trailing three-month average sales pace against current active inventory.
I publish this report monthly with updated data from the MLS. If you want analysis specific to your neighborhood, subdivision, price range, or property type, reach out. I'm happy to run a custom breakdown.
Want the numbers for your neighborhood?
Jared Dineen Shanstrom, REALTOR® | The Dineen Shanstrom Group
(760) 234-2774 | jared@dsgrealtors.com
Data: flexmls (CRMLS) · 82,000+ closed sales analyzed · Jan 2017 – Jun 2026
The Dineen Shanstrom Group · Equity Union · DRE# 02130665
Greater Palm Springs Real Estate · Palm Springs Homes for Sale · Palm Desert Real Estate · Rancho Mirage Homes · La Quinta Real Estate · Indian Wells Luxury Homes · Cathedral City Homes · Indio Real Estate · Bermuda Dunes · Coachella Valley Housing Market · Desert Real Estate Market Report

Jared Dineen Shanstrom is a trusted real estate professional known for his calm, client-focused approach and deep knowledge of the Greater Palm Springs market. As the founder of The Dineen Shanstrom G....
By Jared Dineen Shanstrom, REALTOR, The Dineen Shanstrom Group at Equity Union · September 8, 2026The short versionThe 30-year fixed mortgage sits around 6.74 percent as of
Coachella Valley Housing Market Update: August 2026 (And Why the Median Is Misleading)By Jared Dineen Shanstrom, REALTOR, The Dineen Shanstrom Group at Equity UnionSeptember 4, 2026 |
Mortgage Rates Near a One-Year High: What It Means for Coachella Valley Buyers and SellersBy Jared Dineen Shanstrom, REALTOR, The Dineen Shanstrom Group at Equity Union · August,
Buyer's GuideBuying a Mid-Century Modern Home in Palm SpringsThe architects, the neighborhoods, and what to actually check before you buy an Alexander.Published August 2026 · By Jared Dineen
 Based on information from California Desert Association of Realtors as of September 20, 2026 3:47 AM UTC The information being provided by California Desert Association of Realtors, SoCalMLS, CRISNet MLS, and CARETS is for the consumer's personal, non-commercial use and may not be used for any purpose other than to identify prospective properties consumer may be interested in purchasing. Any information relating to real estate for sale referenced on this web site comes from the Internet Data Exchange
(IDX) program of the SCalifornia Desert Association of Realtors, SoCalMLS, CRISNet MLS, and CARETS. ZipRealty, Inc. is not a Multiple Listing Service (MLS), nor does it offer MLS access. This website is a service of ZipRealty, Inc., a broker participant of California Desert Association of Realtors, SoCalMLS, CRISNet MLS, or CARETS. This web site may reference real estate listing(s) held by a brokerage firm other than the broker and/or agent who owns this web site.
The accuracy of all information, regardless of source, including but not limited to open house information, square footages and lot sizes, is deemed reliable but not guaranteed and should be personally verified through personal inspection by and/or with the appropriate professionals. The data contained herein is copyrighted by California Desert Association of Realtors, SoCalMLS, CRISNet MLS, and CARETS and is protected by all applicable copyright laws. Any unauthorized dissemination of this information is in violation of copyright laws and is strictly prohibited.
Copyright 2026 California Desert Association of Realtors, SoCalMLS, CRISNet MLS, and CARETS. All rights reserved. Certain information contained herein is derived from information which is the licensed property of, and copyrighted by, SoCalMLS Inc
Data last updated: September 20, 2026 3:47 AM UTC
If a listing displays "Short Sale/Subject to Lender Approval" then that listing has been identified by the seller and the listing broker as a "Short sale." This means that, at the listed price, the proceeds from the sale may not be adequate to pay all liens and costs of sale. Any offer made that does not fully cover the existing amount(s) owed to the lienholder(s) plus the costs of sale could be subject to lienholder approval, which approval may be exercised at the sole and exclusive discretion of the lienholder(s).
Show More...
Based on information from California Desert Association of Realtors as of September 20, 2026 3:47 AM UTC The information being provided by California Desert Association of Realtors, SoCalMLS, CRISNet MLS, and CARETS is for the consumer's personal, non-commercial use and may not be used for any purpose other than to identify prospective properties consumer may be interested in purchasing. Any information relating to real estate for sale referenced on this web site comes from the Internet Data Exchange
(IDX) program of the SCalifornia Desert Association of Realtors, SoCalMLS, CRISNet MLS, and CARETS. ZipRealty, Inc. is not a Multiple Listing Service (MLS), nor does it offer MLS access. This website is a service of ZipRealty, Inc., a broker participant of California Desert Association of Realtors, SoCalMLS, CRISNet MLS, or CARETS. This web site may reference real estate listing(s) held by a brokerage firm other than the broker and/or agent who owns this web site.
The accuracy of all information, regardless of source, including but not limited to open house information, square footages and lot sizes, is deemed reliable but not guaranteed and should be personally verified through personal inspection by and/or with the appropriate professionals. The data contained herein is copyrighted by California Desert Association of Realtors, SoCalMLS, CRISNet MLS, and CARETS and is protected by all applicable copyright laws. Any unauthorized dissemination of this information is in violation of copyright laws and is strictly prohibited.
Copyright 2026 California Desert Association of Realtors, SoCalMLS, CRISNet MLS, and CARETS. All rights reserved. Certain information contained herein is derived from information which is the licensed property of, and copyrighted by, SoCalMLS Inc
Data last updated: September 20, 2026 3:47 AM UTC
If a listing displays "Short Sale/Subject to Lender Approval" then that listing has been identified by the seller and the listing broker as a "Short sale." This means that, at the listed price, the proceeds from the sale may not be adequate to pay all liens and costs of sale. Any offer made that does not fully cover the existing amount(s) owed to the lienholder(s) plus the costs of sale could be subject to lienholder approval, which approval may be exercised at the sole and exclusive discretion of the lienholder(s).
Show More...
